



The quarterly brand health report comes back steady. Awareness holds, sentiment is positive and consideration is where it was a year ago. Meanwhile, the sales team is giving bigger discounts to close deals, and a newer competitor keeps showing up in deals your brand used to win. Both can be true at the same time, because a typical brand health score answers a narrower question than most teams assume.
Brand health describes how people in a brand's market see it, customers and potential buyers alike: whether they know it, what they associate with it and whether they would recommend it. Those measures are useful, but they leave gaps that only show up when the commercial numbers start moving. Below, we go through what goes into a typical score, where a healthy number can hide a weak position and how to read the results so they lead to a decision.
Which numbers sit inside a brand health score
Many ways of measuring brand health are built upon one academic idea, which deals with how people remember brands. In a 1993 paper in the Journal of Marketing, Kevin Lane Keller explained that people internalized brands in two ways: awareness and an image made up of the associations they hold. In his model, a brand has equity with a customer when that person is familiar with it and holds favorable, strong and unique associations related to it.
Survey-based brand health scores are usually built on that split, with additional measures of intent and behavior. A typical set covers:
- Awareness: whether people know the brand, prompted or unprompted
- Associations: what they connect with it, such as quality, values or price
- Consideration: whether it makes the shortlist when they are ready to buy
- Preference: whether they would pick it over the alternatives
- Recommendation: whether they would put their name behind it to someone else
- Loyalty: whether they intend to stay with it
Each of these answers a different question, which is why brand tracking studies tend to report them separately as well as in an overall figure. The overall number shows direction over time, and the components underneath show a team what to work on.
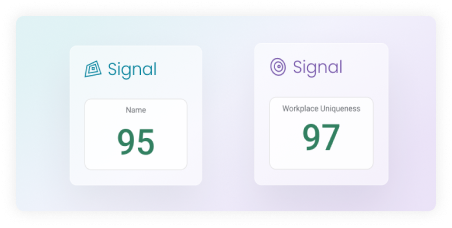
The brandr methodology scores perception across four dimensions and reports each one next to the overall Score. A team reading it can see which area moved and by how much, and whether the total moved with it.
Where a healthy score can hide a weak brand
Scores can stay flat while the brand behind them loses ground. Some parts of a score move faster than others, and some things buyers care about never make it into the survey. Three gaps sit in the survey itself, and a fourth sits inside the company.
Recall without a reason to choose
Awareness and positive associations can both run high for a brand that buyers see as interchangeable with its competitors. Keller's model calls for associations that are favorable, strong and unique. A funnel score shows the last of these least clearly. When people know a brand and like it but can't say what sets it apart, the decision drifts toward price, which is how a steady report and a sales team that keeps discounting can describe the same quarter differently.
What the brand stands for beyond the product
Funnel measures focus on the product and the purchase. They don't deal with how people judge the company's conduct, such as the way it treats its staff, its suppliers and the communities it operates in. All of this sits outside the funnel, and a single reputation rating says little about which part of that conduct people are reacting to. Those views can build up under a stable consideration score over a long period. A survey that never separates those views therefore has no early reading on when they start to influence whether customers buy and whether job candidates apply.
A recommendation score with no reason attached
A recommendation score, which measures how likely people are to recommend a brand to others, deserves its place as a headline number. In 2003, Frederick Reichheld argued in Harvard Business Review that whether customers would recommend a company predicted its growth better than satisfaction measures did. The score shows how many people are willing to speak up for a brand. Without an idea of which of the brand's qualities drive the recommendations and which hold them back, a falling score leaves the team guessing where to act.
What does the view from inside the company add?
It adds the perspective of people who deliver the brand's values. Customer research measures what the market believes, and it says nothing about whether the staff who answer the phone, run the project or write the proposal believe the same thing. For brands that customers experience mainly through people, such as service firms and many B2B suppliers, this added perspective decides whether the promise in the marketing matches what customers encounter.
The link between the two was mapped more than thirty years ago. In Putting the Service-Profit Chain to Work, first published in Harvard Business Review in 1994, James Heskett and four Harvard Business School colleagues connected employee satisfaction, loyalty and productivity to the value customers receive, and from there to customer satisfaction, loyalty, profit and growth. In this model, the employee view sits upstream of the customer numbers a brand health report tracks.
The inside view also covers ground a customer survey never reaches. Employees can reveal whether they understand what the brand stands for, whether leadership acts in line with the values and whether they would recommend the company as a place to work. Those answers feed hiring as much as delivery, since the reputation for conduct that customers weigh is the same one candidates weigh when they decide whether to apply. On the customer side, employees who don't recognize the brand's promise struggle to deliver it, and customers feel that gap in the service they receive.
At brandr, the two sides are measured separately: brandr Index covers how the market sees the brand, and brandr Employer Index surveys employees about the company across three dimensions (Branding, Equality and Human Resources). Reading the two together reveals where the outside and inside views agree and where they don't. That gap is the number a customer-only brand health report can't produce.
Reading brand health as a set of decisions
A brand health report pays off when each number points to something a team can change. Whatever the instrument, the same sequence turns a score into a decision:
- Score each dimension separately, so a weakness in differentiation or conduct stays visible even when the overall figure holds.
- Benchmark each dimension against the rest of the category. Compare it with the lowest, average and highest scores, and with the industry figure. This shows whether a result is strong for the market the brand competes in.
- Split the results by audience group, since customers, prospects and other segments can read the same brand very differently.
- Rank the drivers by how much they matter to people and how well the brand performs on them. Start with the ones that matter most and score the lowest.
- Run the same survey again in waves, which lets each new reading compare cleanly with the last and ties a change to what the team did in between.
The same sequence is built into brandr Index. It scores four dimensions: Perception, Social Responsibility, Differentiation and Segmentation. Together, they make up an overall Score from 0 to 100. Next to it sits a Recommendation score from -100 to +100, which splits respondents into Ambassadors, Neutral and Detractors. The framework comes from Dr. Friðrik Larsen, Professor of Marketing at the University of Iceland, and is explained in detail in his three books.
Used this way, the report becomes part of a measurement system that planning can rely on, with each wave giving the next budget discussion a concrete starting point.
A brand health score worth taking to the board
A report going to the board has two questions to answer: whether the brand is getting stronger and what the company should do next. A typical brand health score answers the first in part, which is why it can come back steady while discounts grow and a newer competitor wins deals. The second needs what a single number leaves out: whether buyers see a reason to choose the brand, how they judge its conduct, what drives its recommendations and whether employees recognize the brand customers describe.
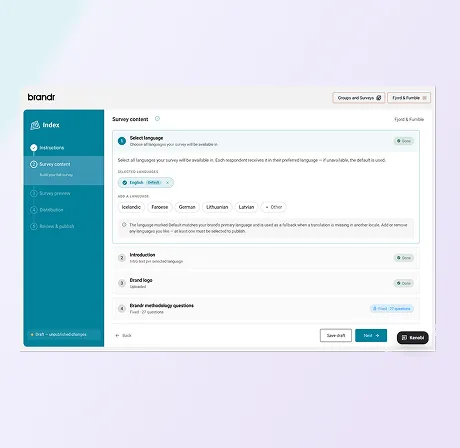
To see where your own brand stands on both sides, you can start a free trial of brandr that includes one survey per product, with no card and no time limit, and build both surveys before choosing a plan.