



Asking employees how work feels to them is the easy part of employee experience measurement. The harder part is getting answers that can be compared from one year to the next and point to a specific team, policy or manager. A survey falls short on both counts when the questions get rewritten between rounds, the scale changes and the results come back only for the company as a whole, because then nobody can say whether a drop is real or where it comes from.
For HR teams and employer brand leaders, the answer is a structure that stays fixed from one survey to the next: a defined set of dimensions, questions people can answer from their own day-to-day work and results reported by group.
The starting point is what employee experience measurement covers and the practices that turn it into guesswork. From there come the metrics worth tracking and five steps for running a survey whose results hold up over time.
What is employee experience measurement?
Employee experience measurement is a regular, structured way of finding out how people experience working at an organization. It covers what employees see and deal with day to day, such as how clearly leadership explains where the company is heading, whether people are treated fairly and how smoothly onboarding and other HR processes run. A single survey gives a snapshot, and measurement repeats it on the same terms so the results can be compared.
It helps to keep two kinds of answers apart. Some questions ask about the experience itself, such as whether a manager explains decisions. Others ask about outcomes, such as whether someone would recommend working there or intends to stay. Outcomes tell teams that something is wrong, and the experience questions show them where.
Employee experience is also a fairly new research topic. A 2025 review of the international research by Laura Szabó and Anita Kozák found that few studies had produced validated scales for measuring it, and the most common approach was a questionnaire assembled from earlier ones, mostly employee satisfaction surveys. For an HR team, that means choosing the structure of the survey deliberately, before the first round goes out.
Where the guesswork comes in
Much of the guesswork in employee experience measurement comes from decisions made before the survey is sent, or from decisions nobody made at all. These five practices are the usual causes of guesswork:
- Questions rewritten for each round, so this year's score answers a slightly different question from last year's
- Answer scales that change between rounds, such as five points one year and ten the next
- Results reported only for the company as a whole, so a struggling team or location disappears into the total
- Reporting groups chosen after the results arrive, which leaves some groups too small to show without exposing who answered
- Scores read with nothing to compare them to, so nobody can say whether 68 out of 100 is good for the industry
Each of these makes a change in the numbers hard to explain. A score that drops after the questions were reworded may only reflect the new wording, and a steady company total can hide one department that fell while another rose. Most of them can be fixed before launch, starting with what the survey measures in the first place.
Which employee experience metrics to track
Employee experience measurement works best when its metrics sit in three layers: the broad areas the survey covers, the specific things people rate within each area and the workforce figures read next to the results.
Dimensions that give the survey a structure
A dimension is a broad area of working life that the survey covers every round, such as how employees see the company as an employer, whether people are treated equally and how well aspects of HR like hiring, development and pay work for them. The dimensions stay fixed from one round to the next. Individual questions inside a dimension can be refined over time, and each round's results can still be set against the last because the areas they measure haven't changed.
Drivers people can rate directly
Drivers are the specific things inside a dimension that employees can judge from their own experience. A driver list can cover both the experience and the outcome questions, with leadership clarity, trust in management and strategic alignment on one side and engagement and retention risk on the other. A question about a driver names something concrete, such as whether people understand how their work connects to the company's goals, which also makes it clearer who in the organization can act to rectify a low score.
Workforce figures to read alongside
Survey answers gain weight when they are read with the HR data the company already keeps. ISO 30414, the international standard for human capital reporting revised in 2025, sorts that data into 11 areas, among them workforce turnover as well as health, safety and well-being. Useful figures to pair with the survey include:
- Voluntary turnover
- Absence rates
- Internal moves and promotions
- Take-up of training and development
Break these down by the same groups as the survey, so a low score and a rising figure can be traced to the same team or location. The survey measures that give the earliest warning of people leaving are covered in the employer branding metrics that predict retention.
How to measure employee experience in five steps
In employee experience measurement, the first three steps happen before anyone answers and the last two once the results are in.
1. Write down the decisions the results will feed
Before writing a single question, list the decisions the survey should inform this year. That might be where to spend the development budget, which managers need support or whether a new hybrid working policy is doing what it was meant to. Each decision tells you which dimensions and drivers the survey needs and which groups the results have to be split by.
2. Build the employee experience survey on dimensions and drivers
Set the dimensions first, then the drivers under each one, then one question per driver. Use one answer scale for every question and keep it for every future round. A short survey is easier to finish, and a higher response rate means more groups have enough answers to report.
3. Set reporting groups and the anonymity threshold before launch
Decide how results will be split, such as by department, location or length of service, and set the minimum number of responses a group needs before its results are shown. While the structure is still open, merge any groups likely to fall below that number. Mention the threshold in the survey invitation, so people know their answers can't be traced back to them.
4. Read results by group against a reference point
Compare each group with its own previous round, with the company as a whole and with an industry benchmark where one exists. Start at the dimension level to see where a group stands, then go down to the drivers to find the specific thing behind a low result. The workforce figures for the same group show whether the survey and the HR data point the same way.
5. Tell employees what changed, then measure again
Share a short summary of the results with the groups that answered, along with one or two changes made because of the results. Run the next round on the same structure, since employee experience measurement shows direction only once there are two rounds to compare. Plan a full survey once or twice a year, with shorter check-ins on a few drivers in between when a change needs watching.
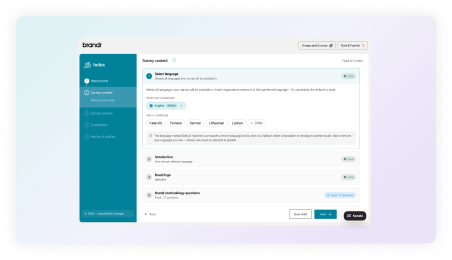
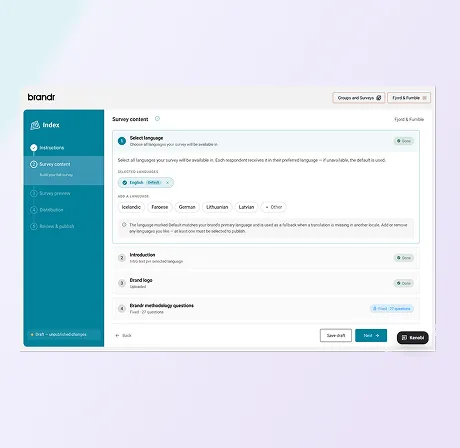
On brandr Employer Index, the dimensions and drivers from step 2 come built in, and so does the minimum response threshold from step 3. It measures three dimensions, Branding, Equality and Human Resources, through drivers such as leadership clarity, trust in management and retention risk. The dimensions combine into a Score from 0 to 100 that can be benchmarked against the industry. A separate Recommendation score, on a scale from -100 to +100, shows whether employees would speak up for the company: the share of Ambassadors minus the share of Detractors, with Neutral respondents counted in neither. Each employee spends about four minutes on the survey. How each score is calculated is set out on the methodology page.
What a steady reading gives HR teams
Once the dimensions, drivers, answer scale and reporting groups are fixed, a change in the results can be explained. An HR team can say whether a drop is real, which group it comes from and which driver sits behind it, and the following round shows whether the change made in response did anything. Over several rounds, employee experience measurement becomes a record the team can use to decide where the next budget goes and which managers to talk to first.
The employees who answered gain from the same structure, since a survey that leads to visible changes gives them a reason to answer the next one as openly as they answered this one.
HR teams can start a free trial of brandr with one brandr Employer Index survey included, no card and no time limit. The trial covers building the survey and importing the recipient list before choosing a plan.